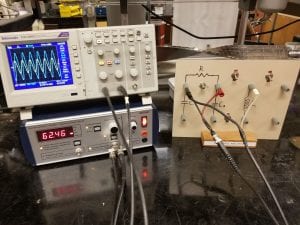
This demo utilizes a series bandpass and series bandstop filter to demonstrate the resonance that occurs when combining a resistor, capacitor, and inductor in one circuit.
Materials:
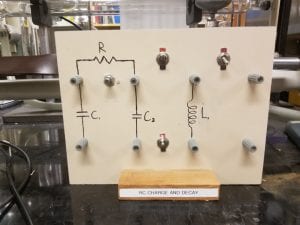
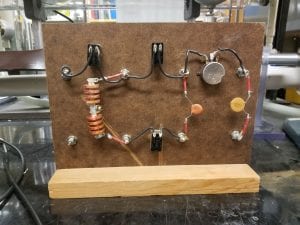
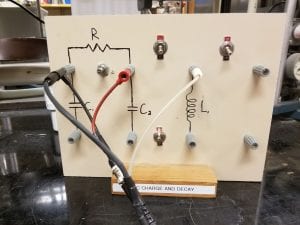
- RLC resonance board: This board has a variable resistor, capacitor, and inductor attached to the back. and allows for a variety of connections between the two (Figure 2). The variable resistor, or potentiometer, allows for adjustments of the cutoff frequency of the filters. (Figure 3)
- Function Generator: Produces an AC voltage to excite the RLC circuit. (Figure 3)
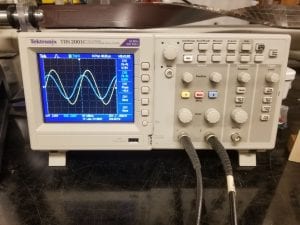
- Oscilloscope: Helps visualize the behavior of the output voltage as a function of time, and is compared with the input voltage from the function generator. (Figure 4)
- BNC Cables: Three of the BNC cables are required to make connections between the function generator to RC board, function generator to oscilloscope, and oscilloscope to RC board. One must be BNC to BNC while the other two are BNC cables with male banana jack ends.
Setup:
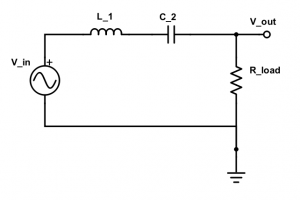
To show the resonance between a resistor, capacitor, and inductor, we will be setting up a series bandpass and series bandstop filter. Putting each of the components on the RLC board is as simple as flipping the bottom switch to the on position, and turning off all the others, see Figure 1. Then its just a matter of making the proper connections, which are shown in Figure 6 and Figure 7 below.
In Figure 6, the black and white banana jacks come from the function generator while the black and red jacks come from the oscilloscope.
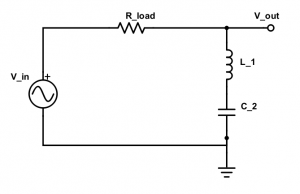
The setup for the series bandstop filter is very similar. It only requires switching the polarity of the input voltage, and taking the output voltage instead across the capacitor and inductor in series. The finished product is shown below in Figure 8 with a circuit diagram for guidance in Figure 9.
Once physical setup is finished, there are several notes which will help show the characteristic trends of each filter on the oscilloscope. Due to the setup, varying the potentiometer will only change the quality factor, or sharpness of the pass band or stop band on each filter. This leaves the resonant frequency unchanged, which is useful to note in order to show the trends at resonance on the oscilloscope.
For the bandpass configuration, I found the resonance to be around 55 kHz. Turning the potentiometer knob will increase the quality factor, increasing the sharpness of the peak at this frequency. Adjusting the potentiometer and scanning through frequencies near the resonance will be useful to show changes in the output spike at resonance. Most potentiometer values will work for the bandpass setup except for when the knob is turned fully counter clockwise. This reduces the resistance so much that it falls out of the expected operation trends.
The bandstop configuration requires more specific input to view the important trends. To begin, the potentiometer dial should be turned nearly all the way counter clockwise, but not all the way. This sets the resistance to a low value to observe a broad stop band, but not so low that it shows no signal at all. The resonance, or peak of the stop band, occurs around 33 kHz. Above 70 kHz the output begins to drop again, most likely due to stray capacitance in the system.
Explanation:
To understand the trends of this series RLC circuit we may either pursue a conceptual understanding or use the mathematical model of this circuit to produce these trends. To begin we will build up the theory behind this setup until the overall trends drop out or become clearer to understand. To start we will find the total impedance of this series setup as shown below.
Where is a phasor in this form which has real and imaginary components as shown below.
In addition, this phasor has an important magnitude which we will need later in the manipulations.
From this equation we can define a resonance frequency which minimizes the total impedance.
Now we can move on to calculate the total current flowing through the components for a particular frequency. Being that the components are in series, the current through each is equal and will be denoted as because it is supplied by the source.
With this source current calculated we can individually calculate the voltage across components to estimate their trends with varying frequency. We group the inductor and capacitor together because of their purely imaginary impedances, and compare with the purely real resistor’s impedance.
From this equation we can verify the general trend of the bandpass filter of Figure 7 which takes the output voltage across the resistor. We are interested in the behavior near the resonant frequency, so we plug in the we found previously into the resistor voltage, or output voltage in the case of the bandpass filter.
This calculation tells us that we should expect the ratio of output voltage to input voltage of a bandpass filter to have a maximum of one at the resonant frequency. In fact, this characteristic is where the filter gets its name. The bandpass will pass the maximum signal through the filter at this resonant frequency along with a band surrounding this frequency.
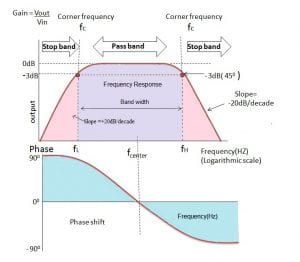
To better understand the equation derived above we examine a plot of this function over changing frequencies as seen below in Figure 10.
The ideal band-pass filter will have a flat pass band, but the RLC filter will have a distinct maximum at the resonant frequency with a gradual decay moving away from this frequency.
To get a better understanding of the workings of a bandstop filter we will start with the voltage across both the inductor and capacitor combined. We are interested in this voltage because it is the output voltage when the series RLC is in the bandstop configuration.
With this equation we’ve derived the ratio of output voltage to input voltage for the bandstop filter. Just as for the bandpass filter we are interested in trends near the resonance frequency so we proceed to plug this in.
From this calculation we note that the ratio of output voltage to input voltage of the bandstop filter will have a minimum of zero at the resonance frequency. In this case too, it becomes clear where the bandstop filter gets its name from. In a band of frequency at and around this resonance frequency, the bandstop has a ratio of output to input of 0. This effectively stops any signal sent from the input to reaching the output.
Now we possess a better understanding of the general trends followed by bandstop and bandpass filters as input frequency is varied. This knowledge will greatly aid in understanding the meaning of voltages changes presented on the oscilloscope when probing the RLC series circuit.
Written by Noah Peake
