There are two versions of this demonstration: one that uses a simple incandescent light bulb and one that displays the peak wavelength through a prism. This demonstration shows the relationship between the temperature of an object to the peak wavelength of the radiation that is emitted from the object.
Version 1:
The first version of this demonstration is very simple: an unfrosted incandescent light bulb is attached to a variac, and as the voltage is increased, the color of the filament in the bulb changes from red to orange to yellow, eventually reaching white.
Equipment
- Variac
- Unfrosted incandescent light bulb
The setup for version one is seen below in Figure 1.

Figure 1: Version 1 setup
Demo
As the voltage on the variac is increased, the filament in the light bulb increases in temperature. It will look redder at lower voltages which correspond to lower temperatures. As the voltage is increased, the filament will appear orange, then yellow, and finally white at its hottest temperature.
Version 2:
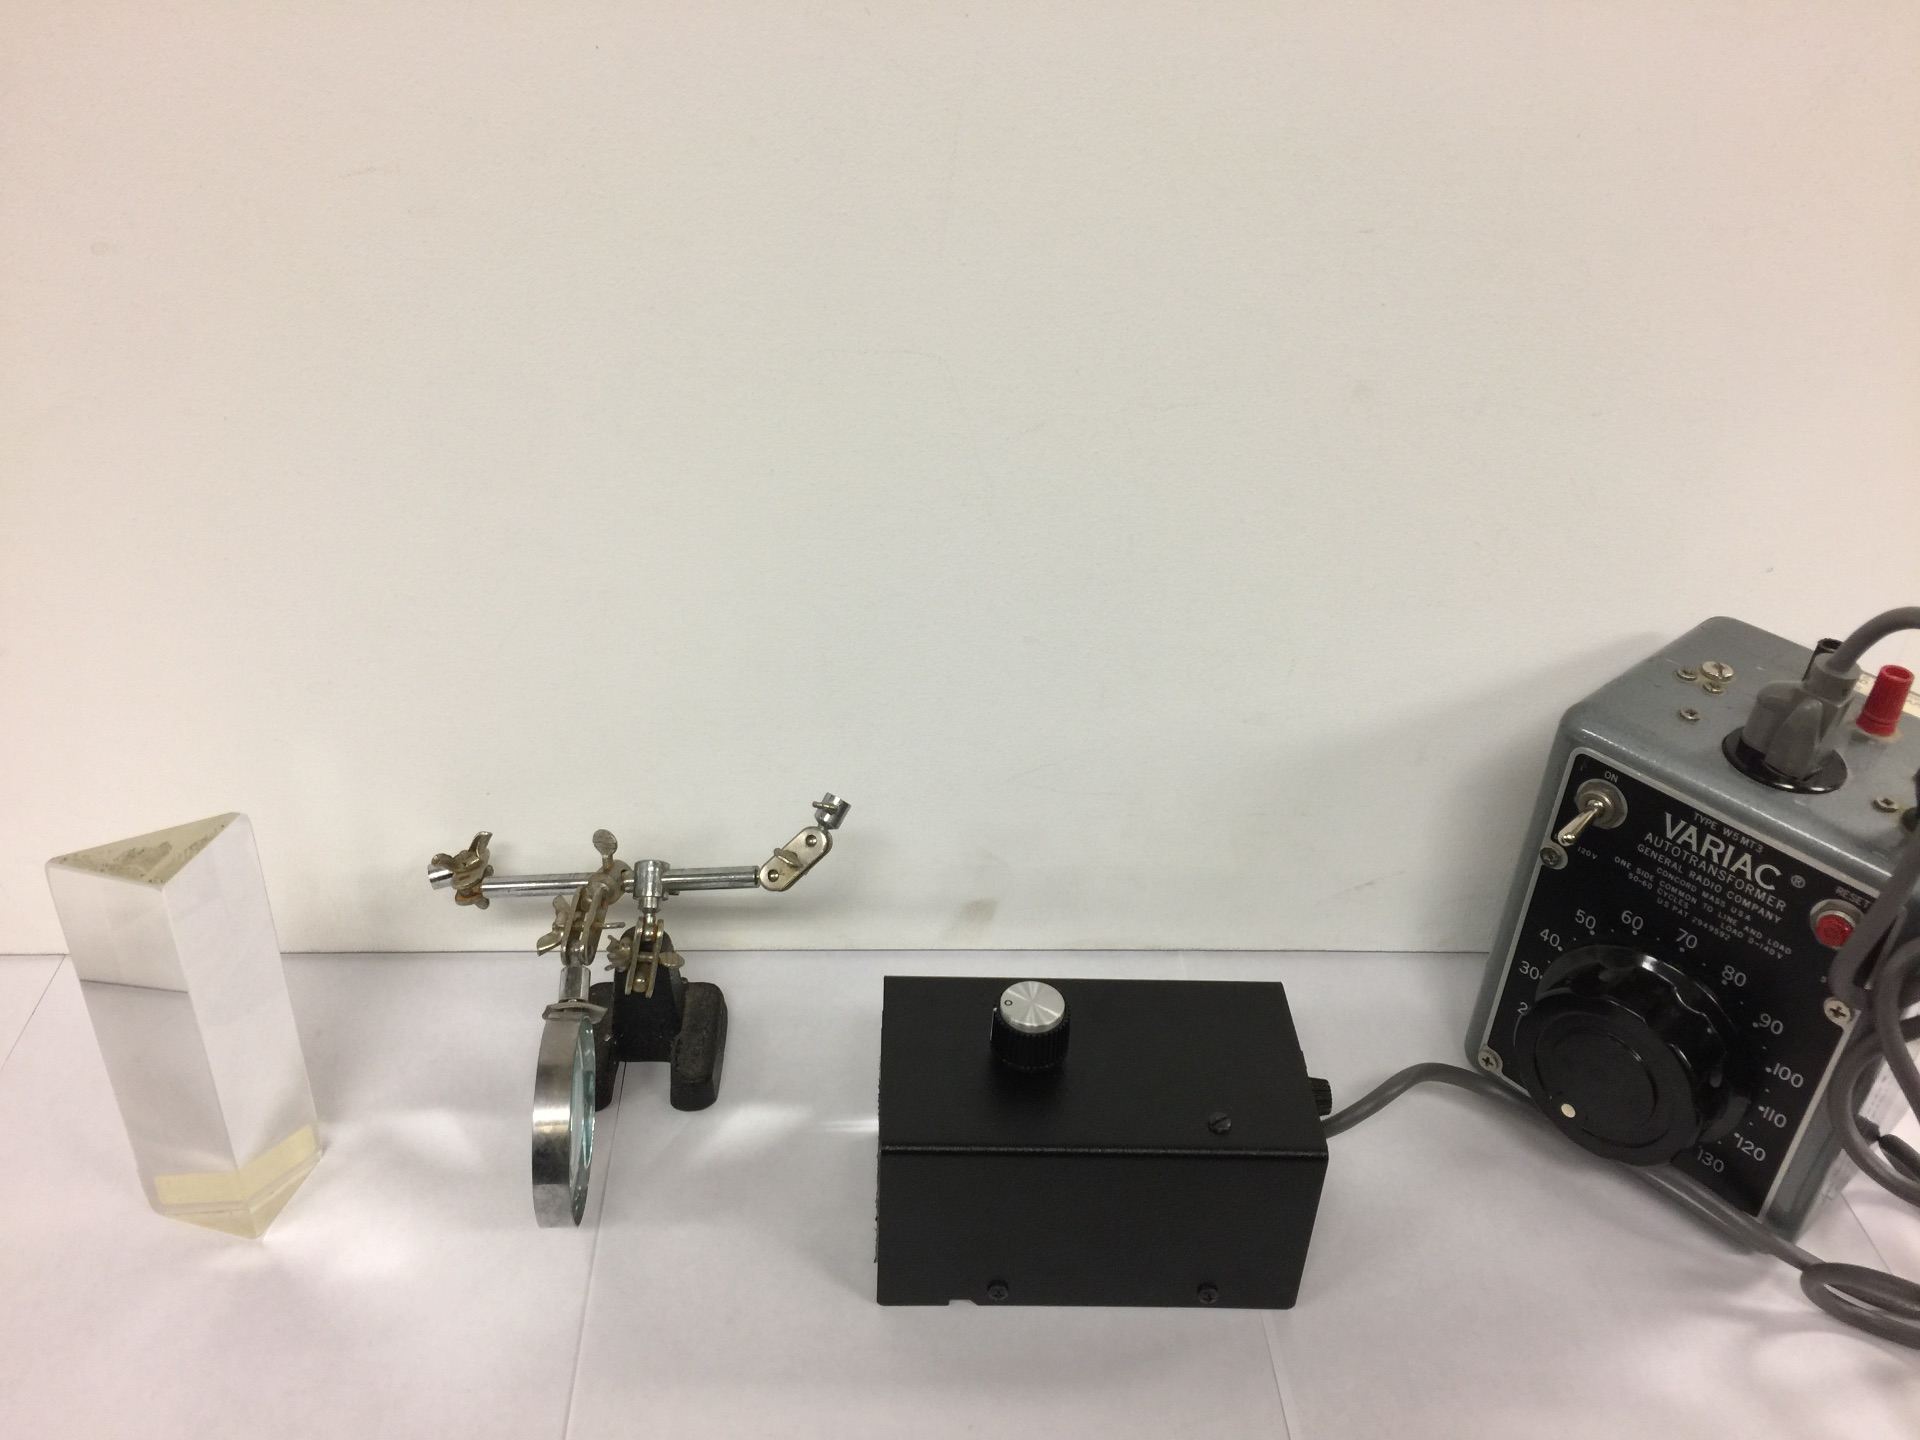
Figure 2: Wien’s law demonstration.
The configuration for the second version of the Wien’s law demonstration is show above in Figure 2. An incandescent light source is attached to a Variac. The light emitted by the filament is collimated by a lens, which focuses the light onto a white background. A prism placed between the lens and the background refracts the light into a spectrum. Increasing the voltage with the Variac increases the temperature of the filament, which increases the peak wavelength of the spectrum.
Equipment
- Pasco Scientific Light Source
- Variac Autotransformer Type W5MT3
- Slit Mask
- Slit Plate
- Prism
- Lens (Focusing Apparatus)
- Red, Green, and Blue Filter
- White Background (Large Canvas)
- Video Camera
Demo
- Attach the Pasco Scientific Light Source to the Variac autotransformer. Turn on the Variac autotransformer to about 50V for the process of collimating the emitted light.
- Place the Slit Mask in front of the Pasco Scientific Light Source.
- Place the Slit Plate on top on the Slit Mask.
- Put the lens between the Pasco Scientific Light Source and the white background, such that the emitted light passes through the lens.
- Adjust the lens such the the emitted light is focused on the white background. This collimates the emitted light from the lens.
- Place the prism in the path of the collimated light. Adjust the position of the prism and rotate it until a clear spectrum is visible. The spectrum will look like a rainbow.
- Adjust the voltage on the variac to see a change in the peak wavelength of the spectrum. Low voltages will result in a redder light. As the voltage is increased, more light from the visible spectrum will be seen.
Explanation
Planck’s law states that a black body, or an object that absorbs all incident electromagnetic radiation, that is in thermal equilibrium will emit a spectral density of electromagnetic radiation at a given temperature:

where B is the spectral density, h is the Planck constant, c is the speed of light, 

The spectral density of electromagnetic radiation emitted by Planck’s law is shown in Figure 3.
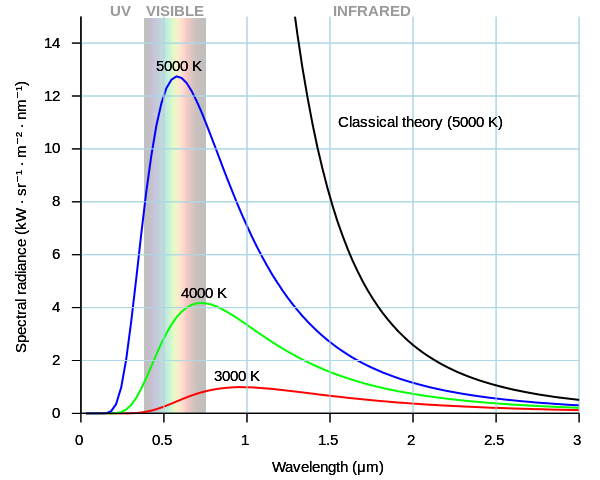
Figure 3: Peak wavelengths are seen for a corresponding temperature. This is Wien’s law.
In the limit of low wavelengths, the radiation emitted from a black body peaks at a wavelength that is inversely proportional to the temperature that the black body is at. This is known as Wien’s law, and it is given by

where 

In this demonstration, the filament in the incandescent light source is not a perfect black body. However, for the course of the demo, it is treated as such. When temperature of the filament is low, the peak wavelength tends to be around visible red light. This is shown in Figure 4.
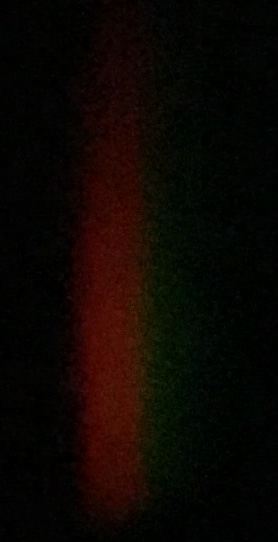
Figure 4:
As the temperature of the filament increases, the peak wavelength decreases. This will cause more of the visible spectrum to be seen. Figures 5, 6, and 7 are shown in order of increasing filament temperature.
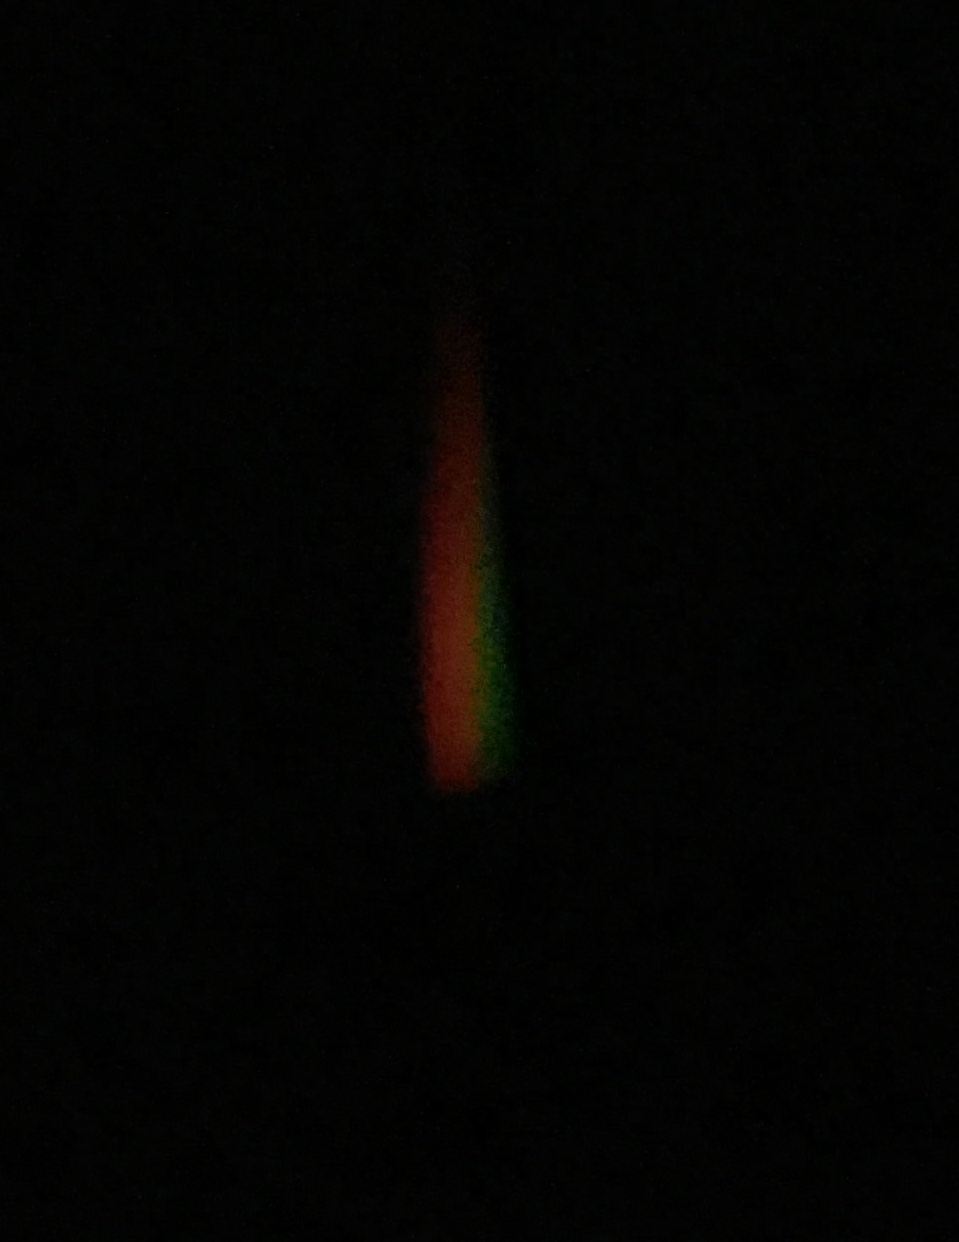
Figure 5:
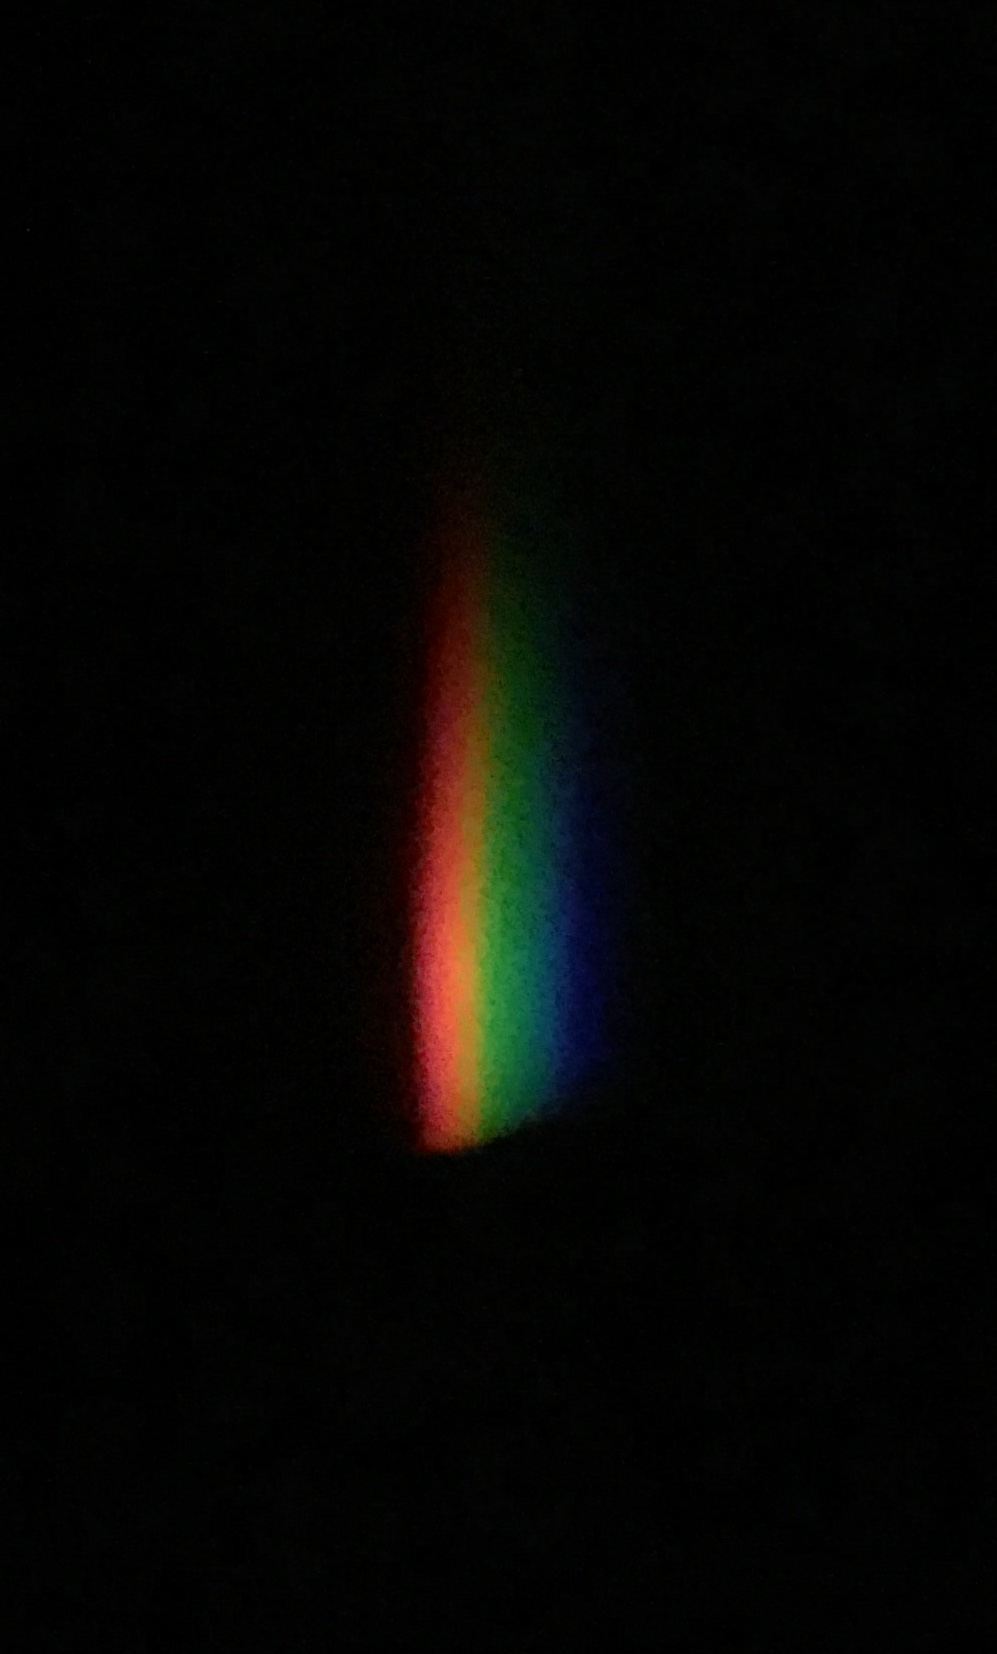
Figure 6:
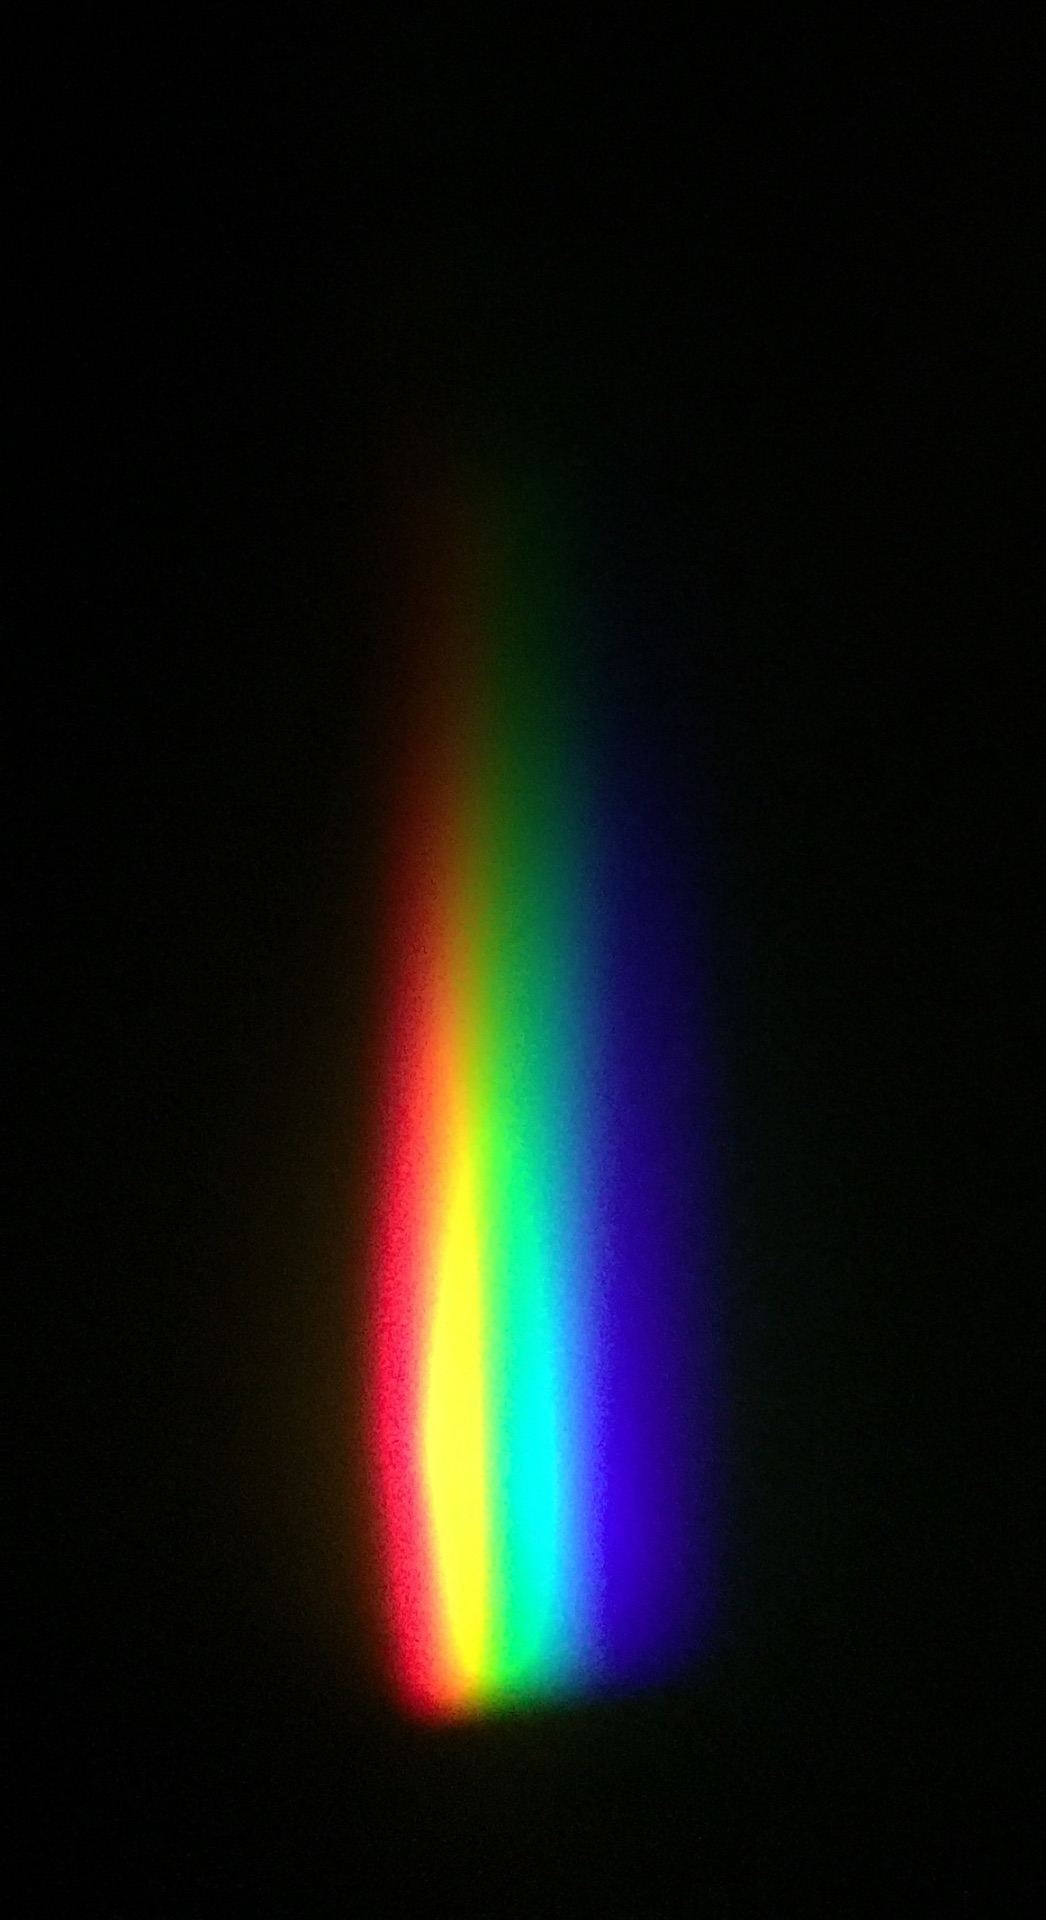
Figure 7:
The demonstration can only reach up to a certain peak wavelength, due to the choice of the filament and the restriction of the voltage, which restricts the temperature of the filament. If the temperature of the filament were to continue to increase, the peak wavelength would continue to reach blue light, and eventually ultraviolet. Eventually, the red light would start to dim.
Written by Ryan Dudschus