This apparatus demonstrates simple two-slit interference patterns in sound waves. It is able to produce a two slit interference pattern within the lecture hall, allowing students all around the lecture hall to hear the nodes and antinodes that occur due to superposition of sound waves.
Materials:
- Pair of Speakers
- Function Generator (Frendrikson Function Generator works best)
- Banana cables (four medium)
- BNC – banana input adaptor
- 1m Measuring Stick
- Directional microphone (optional)
- Tektronix TDS 2001C Oscilloscope (optional)
Demo:
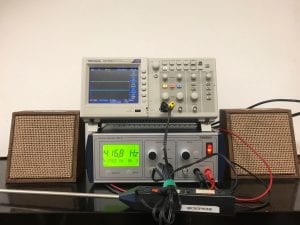
To demonstrate the interference, place the speakers 1m apart using the measuring stick and direct them towards the students. Plug in the speakers to the generator using banana cables and raise the frequency of the generator to approximately 2000 Hz. This seems to be the optimum frequency for use with the microphone, however, 500 – 2500Hz usually work for students. Now have the students plug one ear and move their heads around to hear the minima and maxima produced by sound interference.
Optional: Instructor can use the oscilloscope and a microphone (shown in picture) and walk back and forth in front of the speakers with the microphone in hand. To hook up the microphone use the BNC – banana input adaptor and connect it to Channel 1 of the oscilloscope. Plug in the banana jacks from the microphone to the adaptor. Students should see maxima and minima of the interference on the oscilloscope screen. 2kHz works best for this while using a directional microphone as recommended.
Explanation:
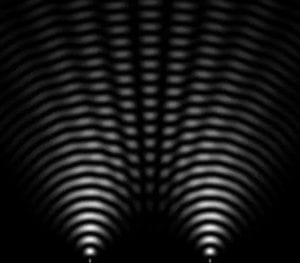
This is a demonstration of the famous double-slit interference pattern, which was the forefront discovery of superposition in wavelengths. The experiment was first performed by Thomas Young in 1801, where he displayed incident light being shone upon two small cuts in a boundary. What he found is that the light wavelengths diffract through the slits and produce a pattern of interference (see Fig 1). This interference pattern produced lines of constructive and destructive interference called antinodes and nodes, respectively. (see Fig 1).

Figure 1. Two slit interference pattern showing destructive interference (dark lines) and constructive interference (bright lines). https://www.quora.com/How-are-dark-and-light-bands-created-in-a-double-slit-experiment
This pattern is easily demonstrated by our Interference Model. There is also a Thin Slit Diffraction demo available to demonstrate the discovery of this phenomenon.
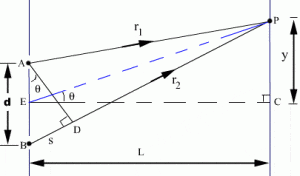
These lines of interference are caused by phase shifts from one source to the other dependent upon how far one wave has travelled with respect to the other wave, given they are in phase to begin. This distance is known as the path difference, and can be used to calculate whether a wave is in phase or not (see distance, s, in Figure 2). When the waves interfere with each other, or collide with each other, if the path difference is an integer multiple of the wavelength, the waves will superpose and create the nodes and antinodes we see in Fig 1. This path difference is calculable by Young’s formula:
where , by geometry.

Figure 2: Young’s Double Slit experiment in a geometrical representation. Distance, s, denotes the path difference, while r_1 and r_2 represent two nodal or anti-nodal lines that construct or destruct to create an image at point p. y is therefore the displacement from the origin, d is the distance between the slits and θ is the angle between the origin and the point p. http://www.citycollegiate.com/interference2.htm
When the demo is being performed, a very similar interference pattern will occur in the classroom. There will be constructive and destructive sound interference produced in the room, thus if students block one ear and move around, they will hear the maxima and minima in the form of volume changes i.e amplitude changes.
Notes:
- Sound waves reflected off the walls tend to reduce the effect.
- Speakers have to be in phase, i.e. they should expand and contract at the same time
Written by Phoenix Gallagher
