Equipment:
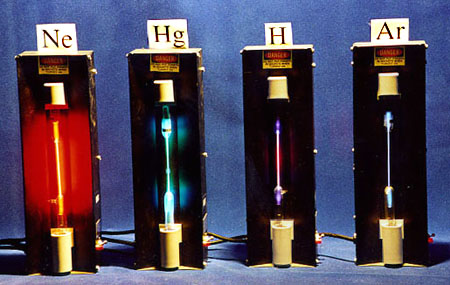
- Gas tubes (Ne, Hg, H, Ar, Water Vapor, N2)
- Lamp boxes
- Diffraction gratings
Demo:
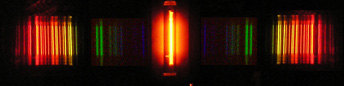
We have various discharge tubes filled with different gases. When the discharge tube is turned on students can observe linear spectra with the help of small plastic slide-like diffraction gratings. There are not enough gratings to pass around for a large class (>70).
Explanation:
Common experiences, such as a rainbow after a storm, tell us that white light may be broken up into its component colors through reflection and refraction as it passes through a prism (or in the case of the rainbow, a water droplet). The light is dispersed into a color spectrum composed of all wavelengths of the visible light spectrum (400 – 700 nm). This is easily replicated in a laboratory setting by simply shining an incandescent light bulb through a prism or diffraction grating. However, a funny thing happens when a gas composed of a single element is heated until it glows and then shown through a diffraction grating.
Instead of seeing a continuous spectrum of colors, there are only discrete bands that correspond to distinct wavelengths of light. These bands are different for every element, and may therefore be used as a sort of “fingerprint” to identify elements (see Figure 2).
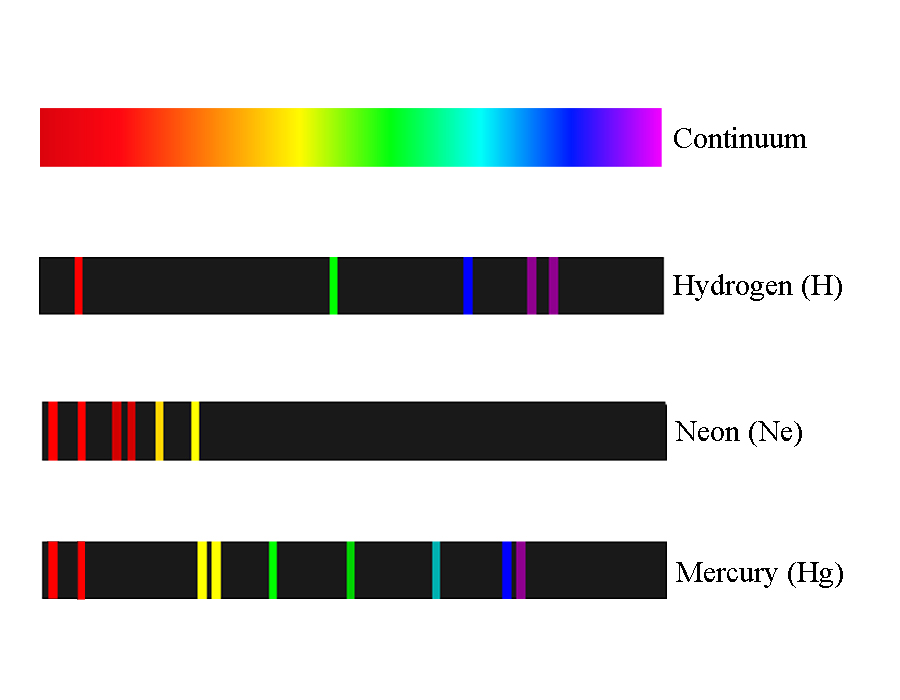
Figure 2: Continuous spectrum of visible light with spectral lines for three different elements.
From a classical viewpoint, this makes no sense. There is no reason for why we should observe such discrete patterns. However, if we look at this from a quantum mechanical point of view, it suddenly becomes much clearer.
Quantum mechanics tells us that energy comes in discrete chunks called “quanta” that have very specific values. As such, atoms and their constituents have very specific energy values that they may possess.
Before the twentieth century, electrons were not to thought to orbit a nucleus at specific locations. In 1913, Niels Bohr proposed that electrons do indeed occupy very specific positions outside the nucleus; like the planets orbiting the sun. Electrons must stay on these orbits when there is no energy being added or subtracted from the system. Once energy is applied, electrons may then make transitions to higher or lower orbits, depending on the change in energy.
When an electron makes a transition to a higher or lower state, a photon is emitted of a specific wavelength under the following relation:

where 


Figure 3: Photon emission as an electron jumps to a lower energy state. Image courtesy of Wikimedia Commons
According to the Bohr model, only certain numbers of electrons may occupy each shell, and only certain transitions are allowed. Therefore, because atoms of different elements have different structures (i.e. different numbers of electrons), no two elements will have the same spectral lines.
The idea of spectral lines is used heavily in astronomy and cosmology to identify the composition of various celestial objects. In much the same way that we may observe emission lines, there are also characteristic absorption lines. For absorption lines to form, a relatively cold atom (i.e. most/all of the atom’s electrons are in their lowest possible energy state) must be near a heat source with significant temperature. Under these conditions, energetic photons from the heat source will be incident on the atom. The incident photons have specific wavelengths which, if these wavelengths correspond to the correct energy, may cause an electron in the atom to move to a higher state. The electron may absorb the photon, and then re-emit a photon of the same wavelength in a different direction (see Figure 4). This means that light at the wavelength of the incident photon will never reach the observer, and there will be blank patches in the spectrum. This absorption spectrum is displayed in Figure 5.
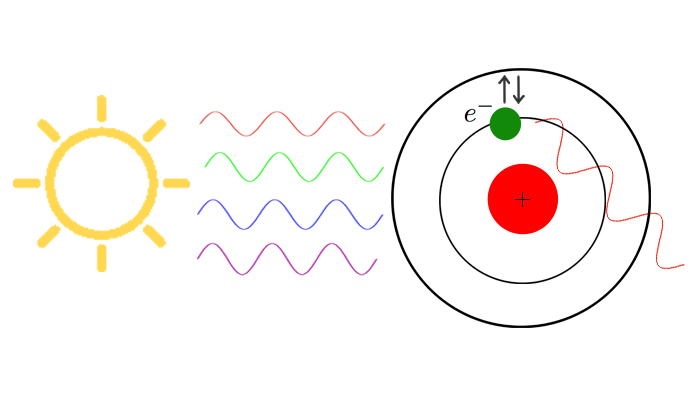
Figure 4: Light from a source of high temperature incident on a single atom.

Figure 5: Absorption lines for hydrogen. Note that the absorption lines correspond to the same wavelengths as the emission lines. Image courtesy of the University of Texas.
In the simplest sense, a star may be viewed as a dense, hot core surrounded by an envelope of gas (as depicted in Figure 6).
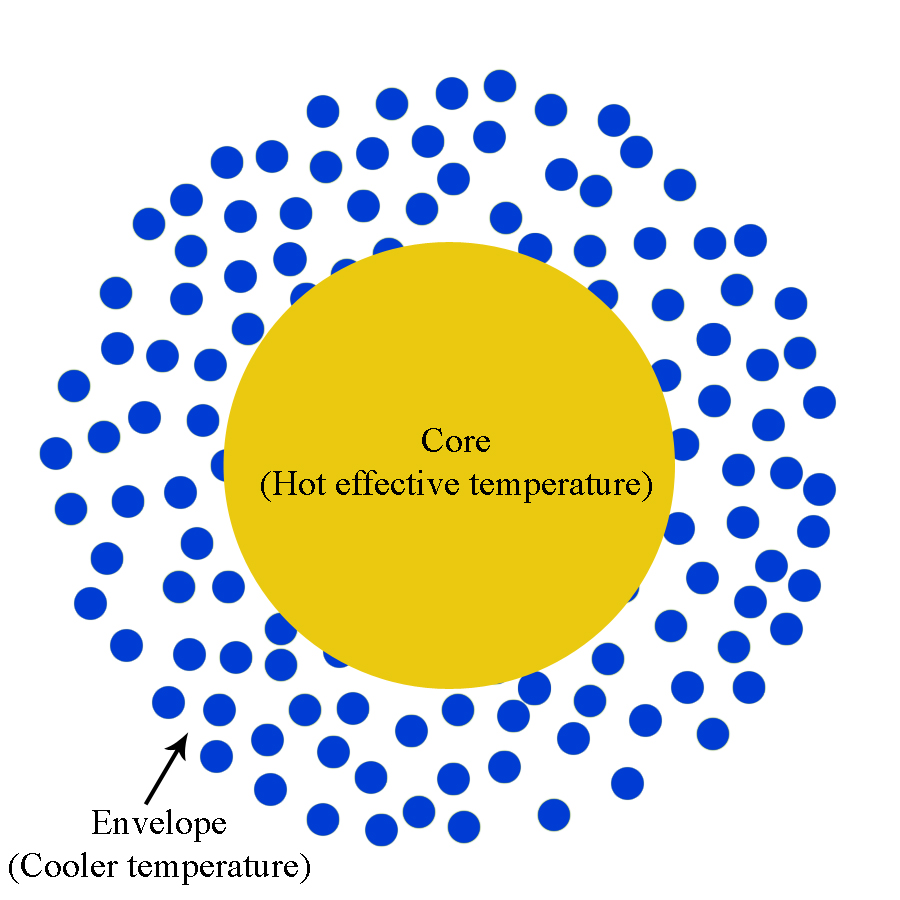
Figure 6: Core of a star surrounded by a gaseous envelope.
The envelope of the star is at a cooler temperature than the core. Therefore, the radiative core will act in the same way as the hot light source in Figure 4. The light from the core will strike the atoms and molecules in the envelope and an observer will see an absorption spectrum from the star such as that in Figure 7. From this, we can see there are absorption lines at specific wavelengths and we can determine the composition of the envelope of the star. Figure 8 shows a zoomed in view of the first hydrogen absorption line, while Figure 9 shows a close up of the second hydrogen absorption line.
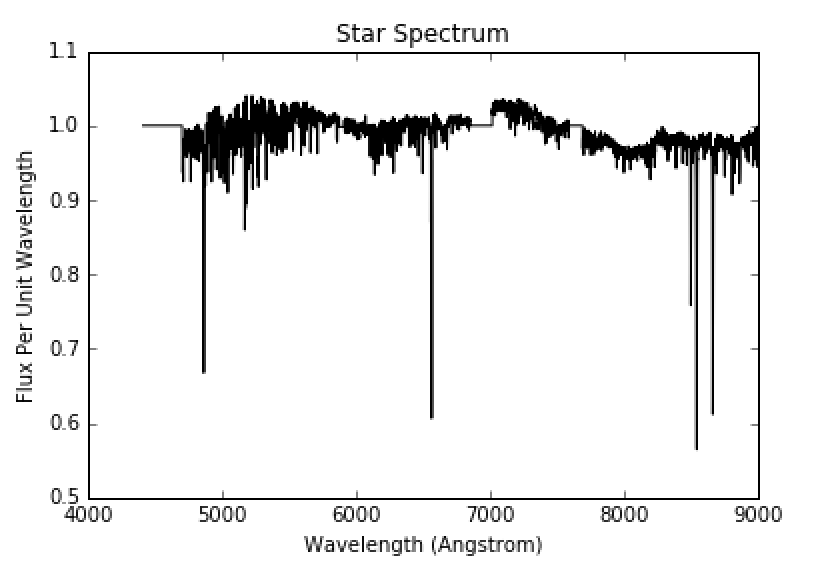
Figure 7: Full star spectrum. Image courtesy of UCO.
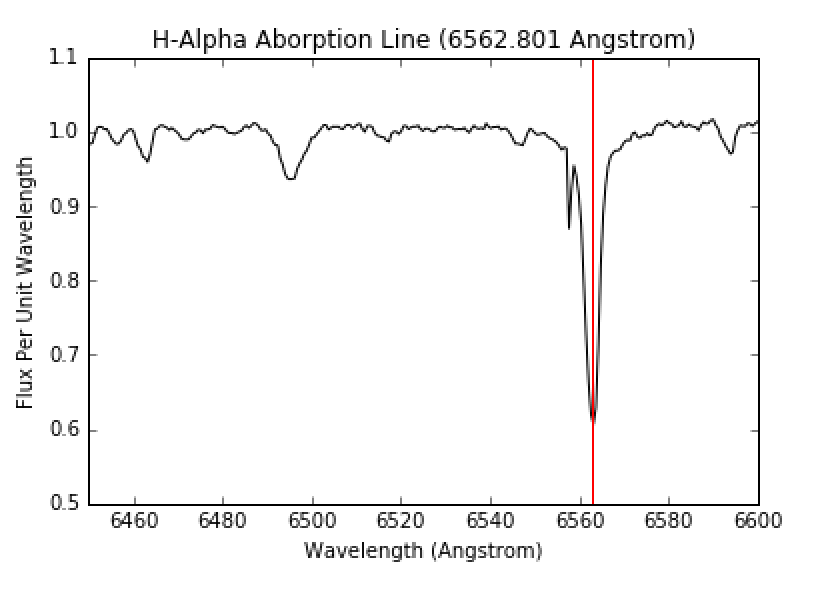
Figure 8: H-Alpha absorption line. Image courtesy of UCO.
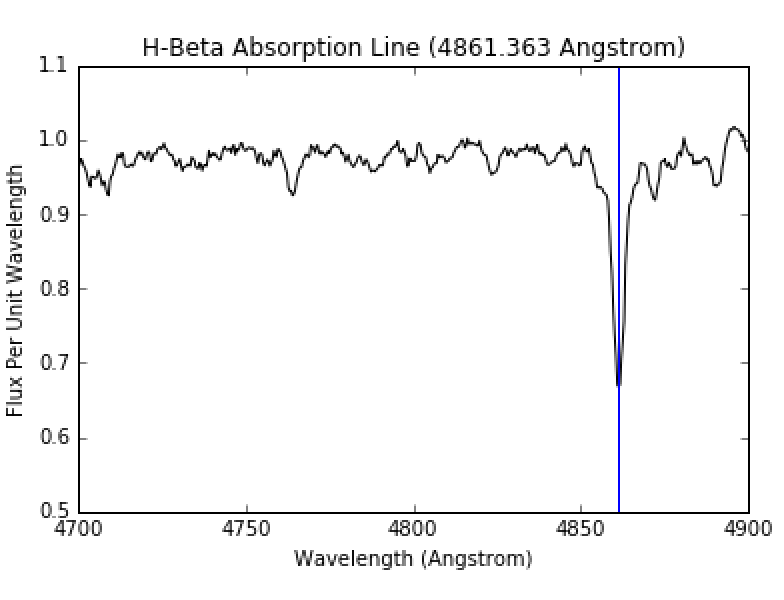
Figure 9: H-Beta absorption line. Image courtesy of UCO.
Written by Madison Harris